Analyzing New York City Taxi Data: a MapReduce approach
Background and motivation for the project
Lauren, Carlos, and I took recently a class on Big Data. We thought that a cool project -involving tons of data- would be to analyze the transport demand in New York City. Given the appearance of new transport options, such as Uber, we wanted to take a look at how these affect the available transport. Since we are interested in designing policies that benefit society, we wanted to have a first look on how much good these new options are doing to the cities.
In this project, we focused our attention on taxi rides. We used publicly available data on yellow cabs and a FOIL request by FiveThirtyEight for the Uber trips.
Objectives
- First, understand the taxi transportation dynamics for New York City (NYC) and how has it been impacted by Uber with the purpose of creating a more informed policy-making regarding mobility in NYC.
- Second, use MapReduce to analyze Taxi and Uber data from NYC.
Has Uber affected yellow taxi demand after big concerts in New York City?
We got data on NYC concerts for Billboard Top 100 artists using Bandsintown API and compared the volume of demand in taxi trips (as percentage of venue total capacity) before and after the establishment of Uber.
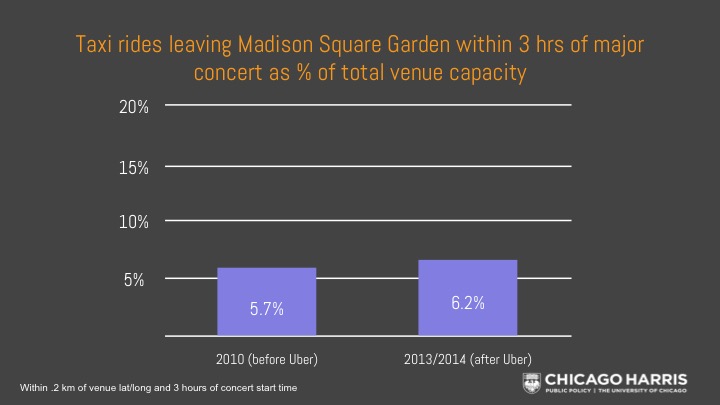
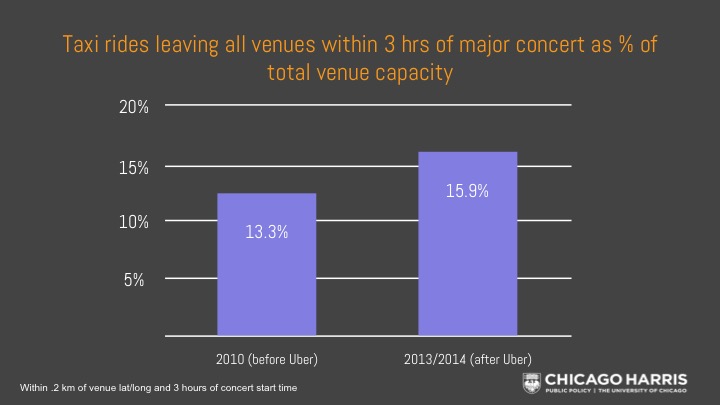
At Madison Square Garden, differences are rather small so it might be only the effect of picking more/less popular concerts on each year. We don’t know trends on taxi rides volume over time, so we might be looking at the trend effect. After this brief analysis, we concluded that we do not have enough concert venues to make statistical significance tests. We neither analyzed the taxi rides volume, so this could be part of our next steps.
What are travel patterns of people in Manhattan at different days (weekdays and weekends) and hours (day and night)?
How likely is it for someone else to be taking a similar trip as you are at the same time?
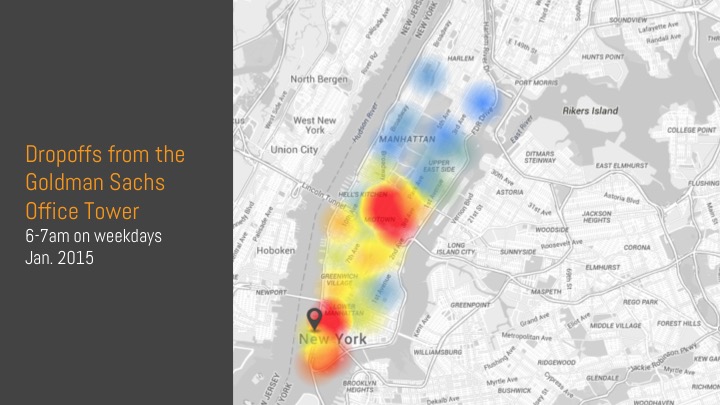
We took trips that started and ended in Manhattan within a specified time window (weekdays, weeknights, and weekends). For each type of trip, we ran an adapted K-Means algorithm (based on provided code) to generate clusters. We then analyzed the number of trips done between clusters, broken down by 30-min periods. This analysis was lengthy, so we drew a random sample to execute it.
For most trips made between 6-7a on January weekdays, starting close to the Goldman Sachs Tower, Midtown, the Battery, or the nearby Wall Street was their destination.
For trips made later in the evening 4-5p, Midtown was still a popular destination, but now Greenwich Village, Chelsea, and Downtown Manhattan were also popular destinations.
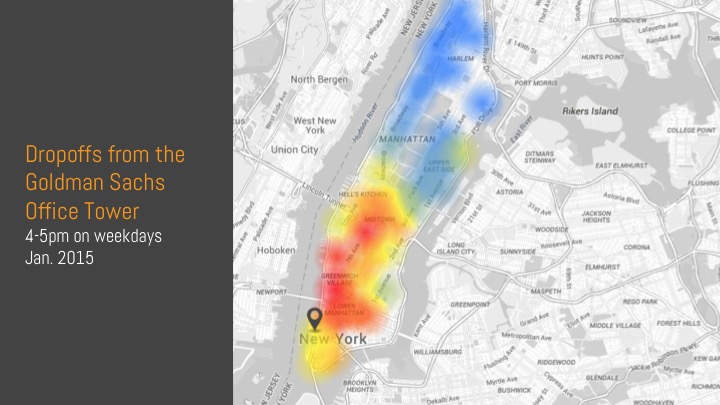
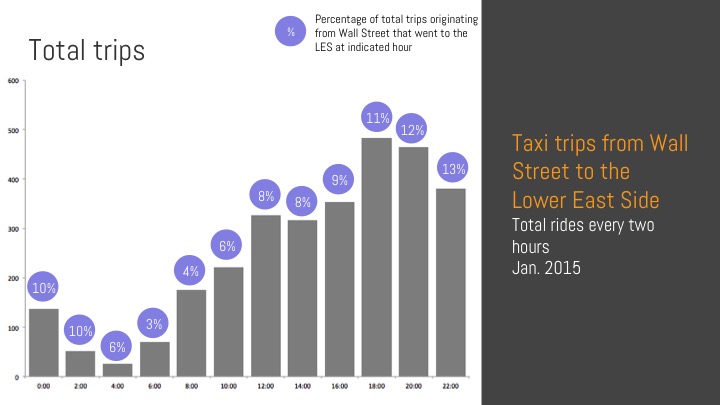
At 6pm, 11% of the rides made from Wall Street go to the Lower East Side, while at 6am it's only 3%. How is the current public transport attending these temporal demands?
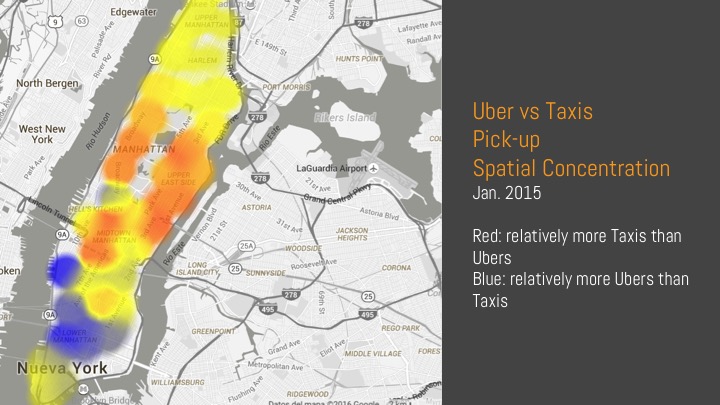
During January 2015, it was much more likely that Ubers were called in Downtown Manhattan when compared to Midtown and Upper East and West Side. Why was this? Were there less Ubers in Midtown/UES/UWS? Were there not enough cabs Downtown so Uber had to cover excess demand? Is people more inclined to use technology-based apps in Downtown Manhattan?
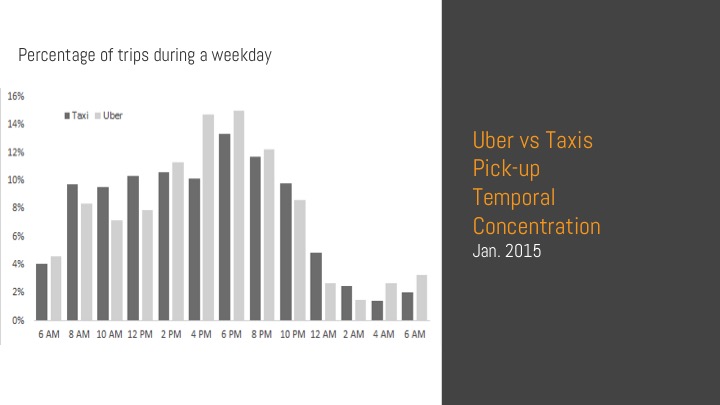
Most trips are made between 8a-10p; with a clear peak at 6p. While taxi demand is relatively flat, Uber demand significantly increases from 2-8p. Are uber drivers more likely to drive at these hours? Does the shift change for taxis at 6p make it particularly busy for Ubers? Why are there less Uber trips in the morning?
Policy Implications
While we made a simple exploratory analysis on the transport in NYC, several interesting questions were raised:
- If there is no apparent change in taxi ride volumes after Uber entered the market, is Uber really competing against taxis? Or is it taking demand away from other methods of transport?
- Is available public transportation covering demand between areas with a high volume of trips?
- How do we design better routes for public transportation, adapting to traffic patterns at different times of the day?
We would love to have more time to explore these questions, but classes are still keeping us busy! Feel free to use everything we have on our repository to do analysis of your own. We used this repo as our own starting point.
Happy hacking!